
Metrics and requests
CPU and memory usage of workloads, pods and nodes, its history over time, and requests recommended from that history.
The pod, workload and node tables show CPU and memory usage as measured by metrics-server, next to requests and limits.
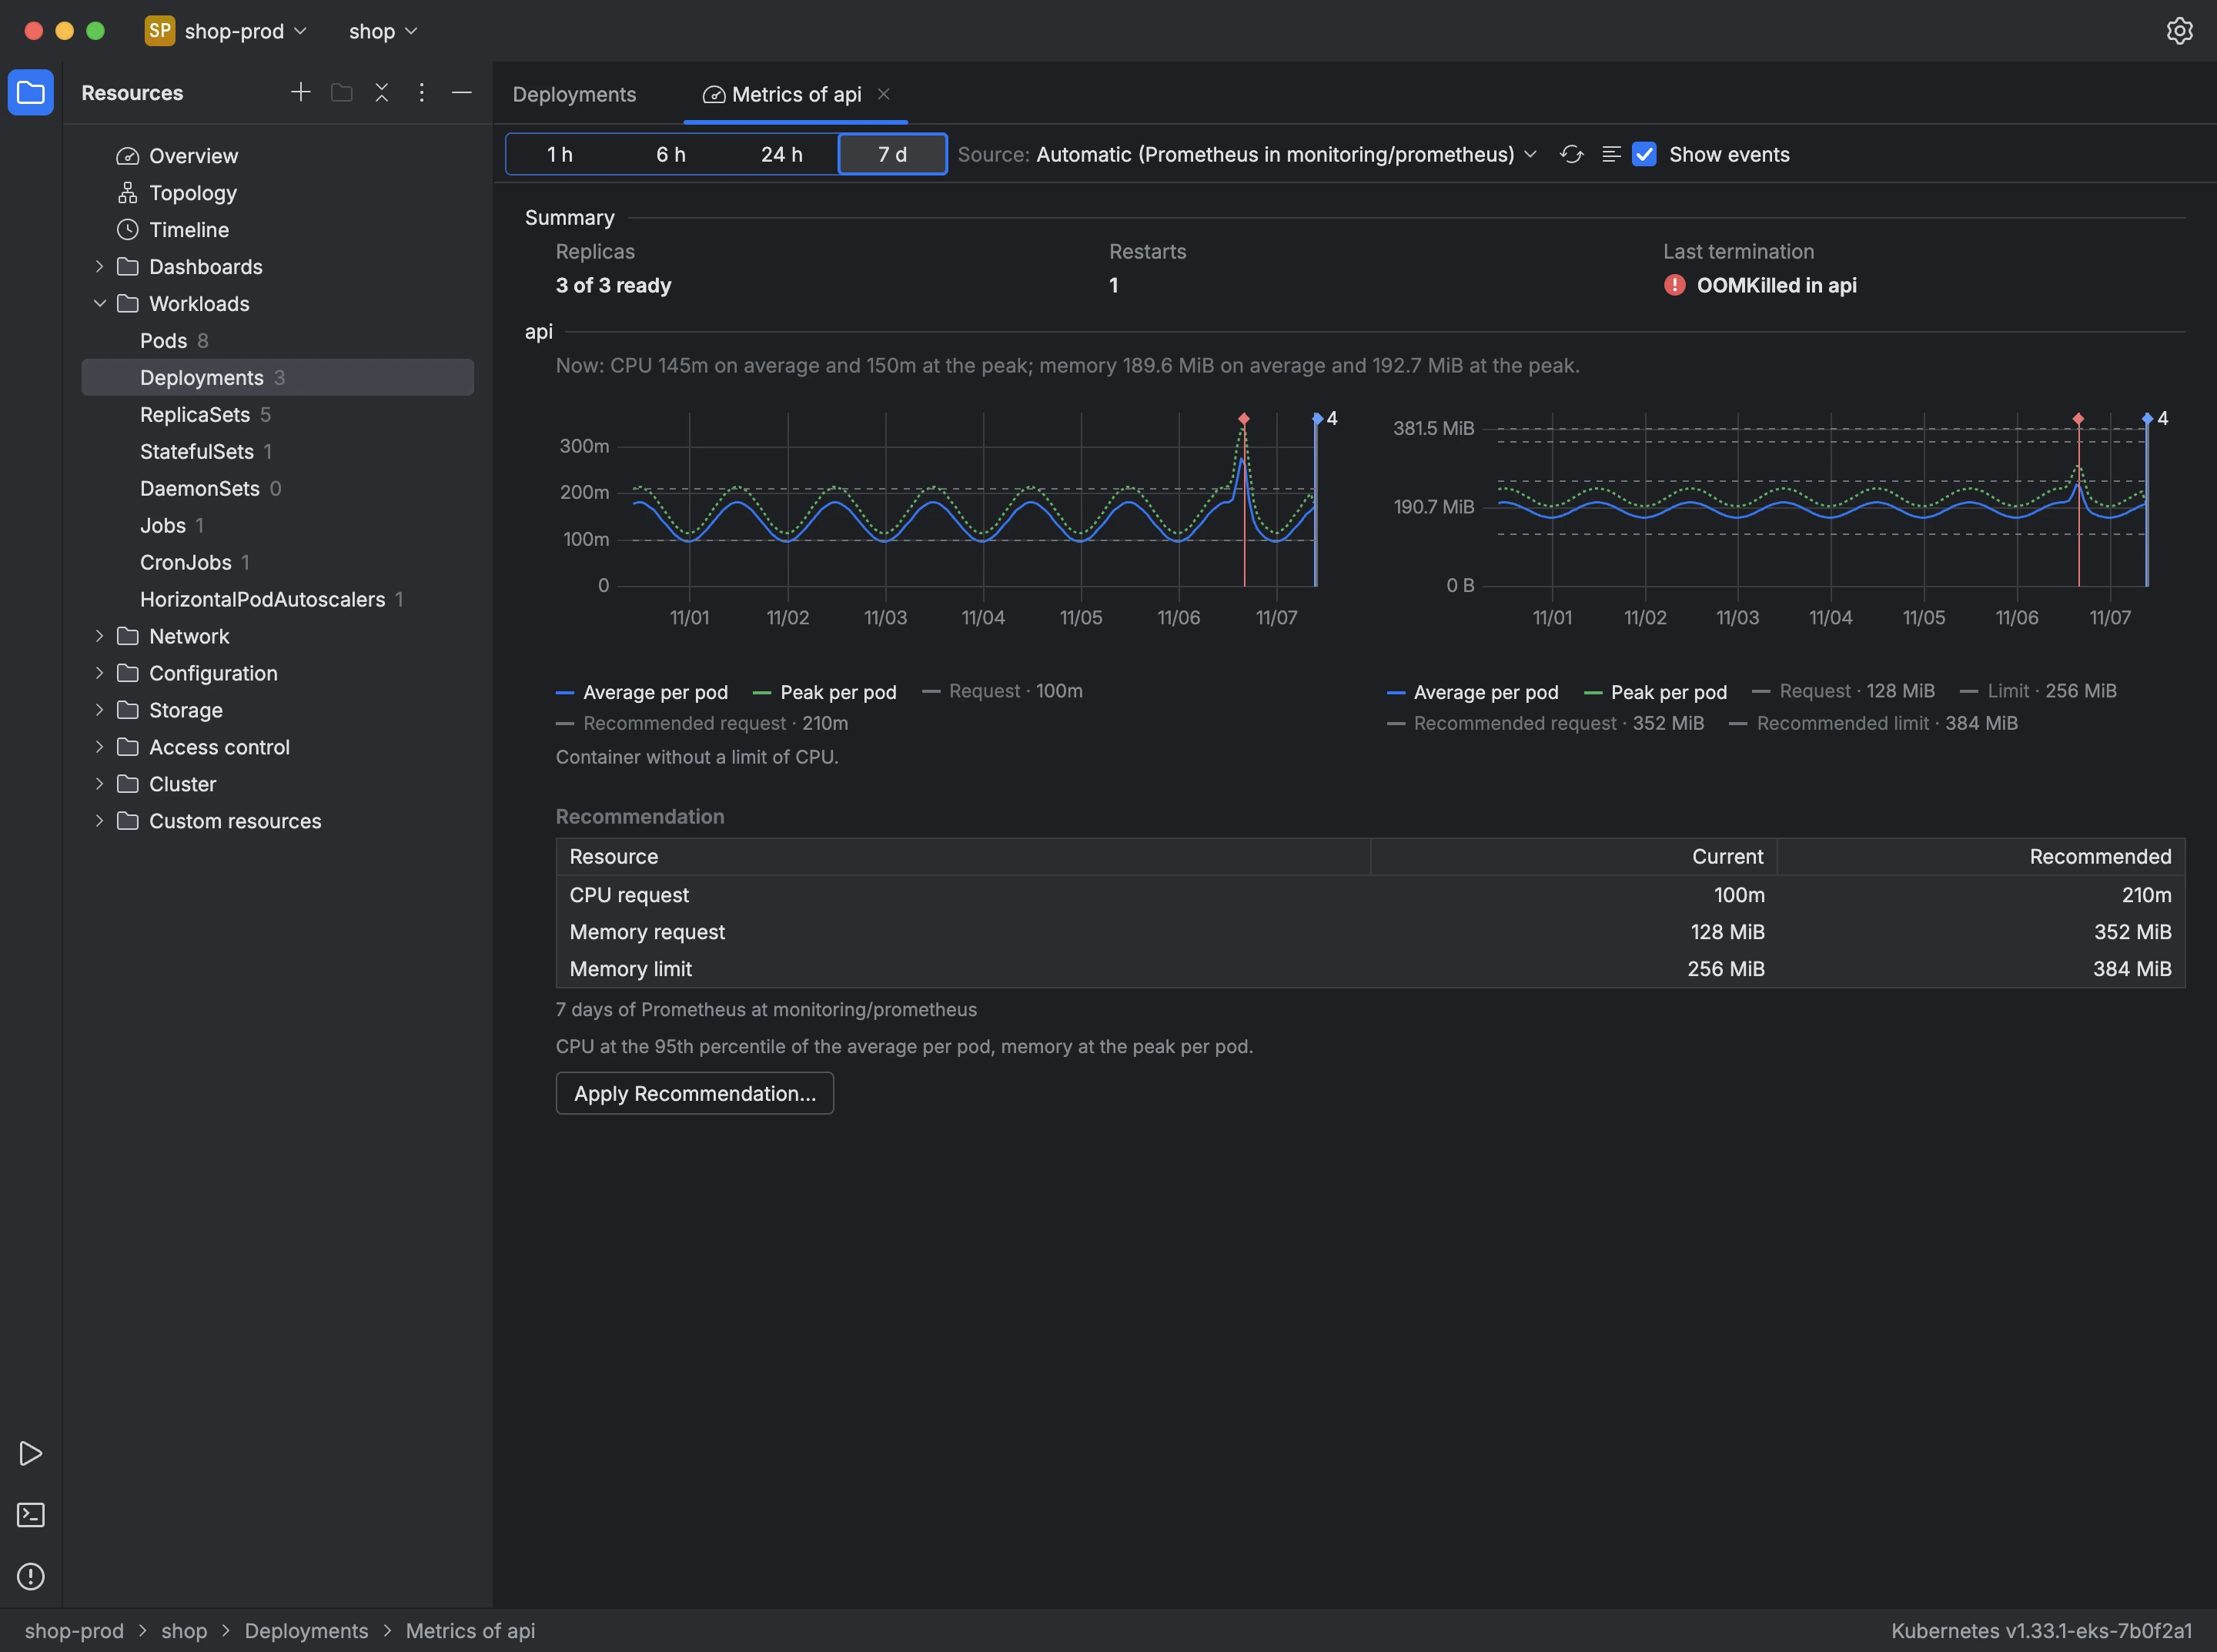
Metrics, in a workload's menu, opens its history: a CPU chart and a memory chart for each container, with the per-pod average and peak, the request and limit, and rollouts, restarts and scaling marked on the timeline. Choose a window from 1 hour to 7 days. The history comes from the cluster's Prometheus when Kuberniq finds one, or from the samples Kuberniq takes while the cluster is open; Source switches between them.
Below the charts, Recommendation compares the current requests and memory limit with values derived from that history, and explains how they were derived. To apply them:
- Press Apply Recommendation….
- Review the diff between the manifest in the cluster and the result of a dry run of the change.
- Press Apply.