
Dashboards
Create and name your own dashboards, with charts of the PromQL queries you write, answered by the context's Prometheus.
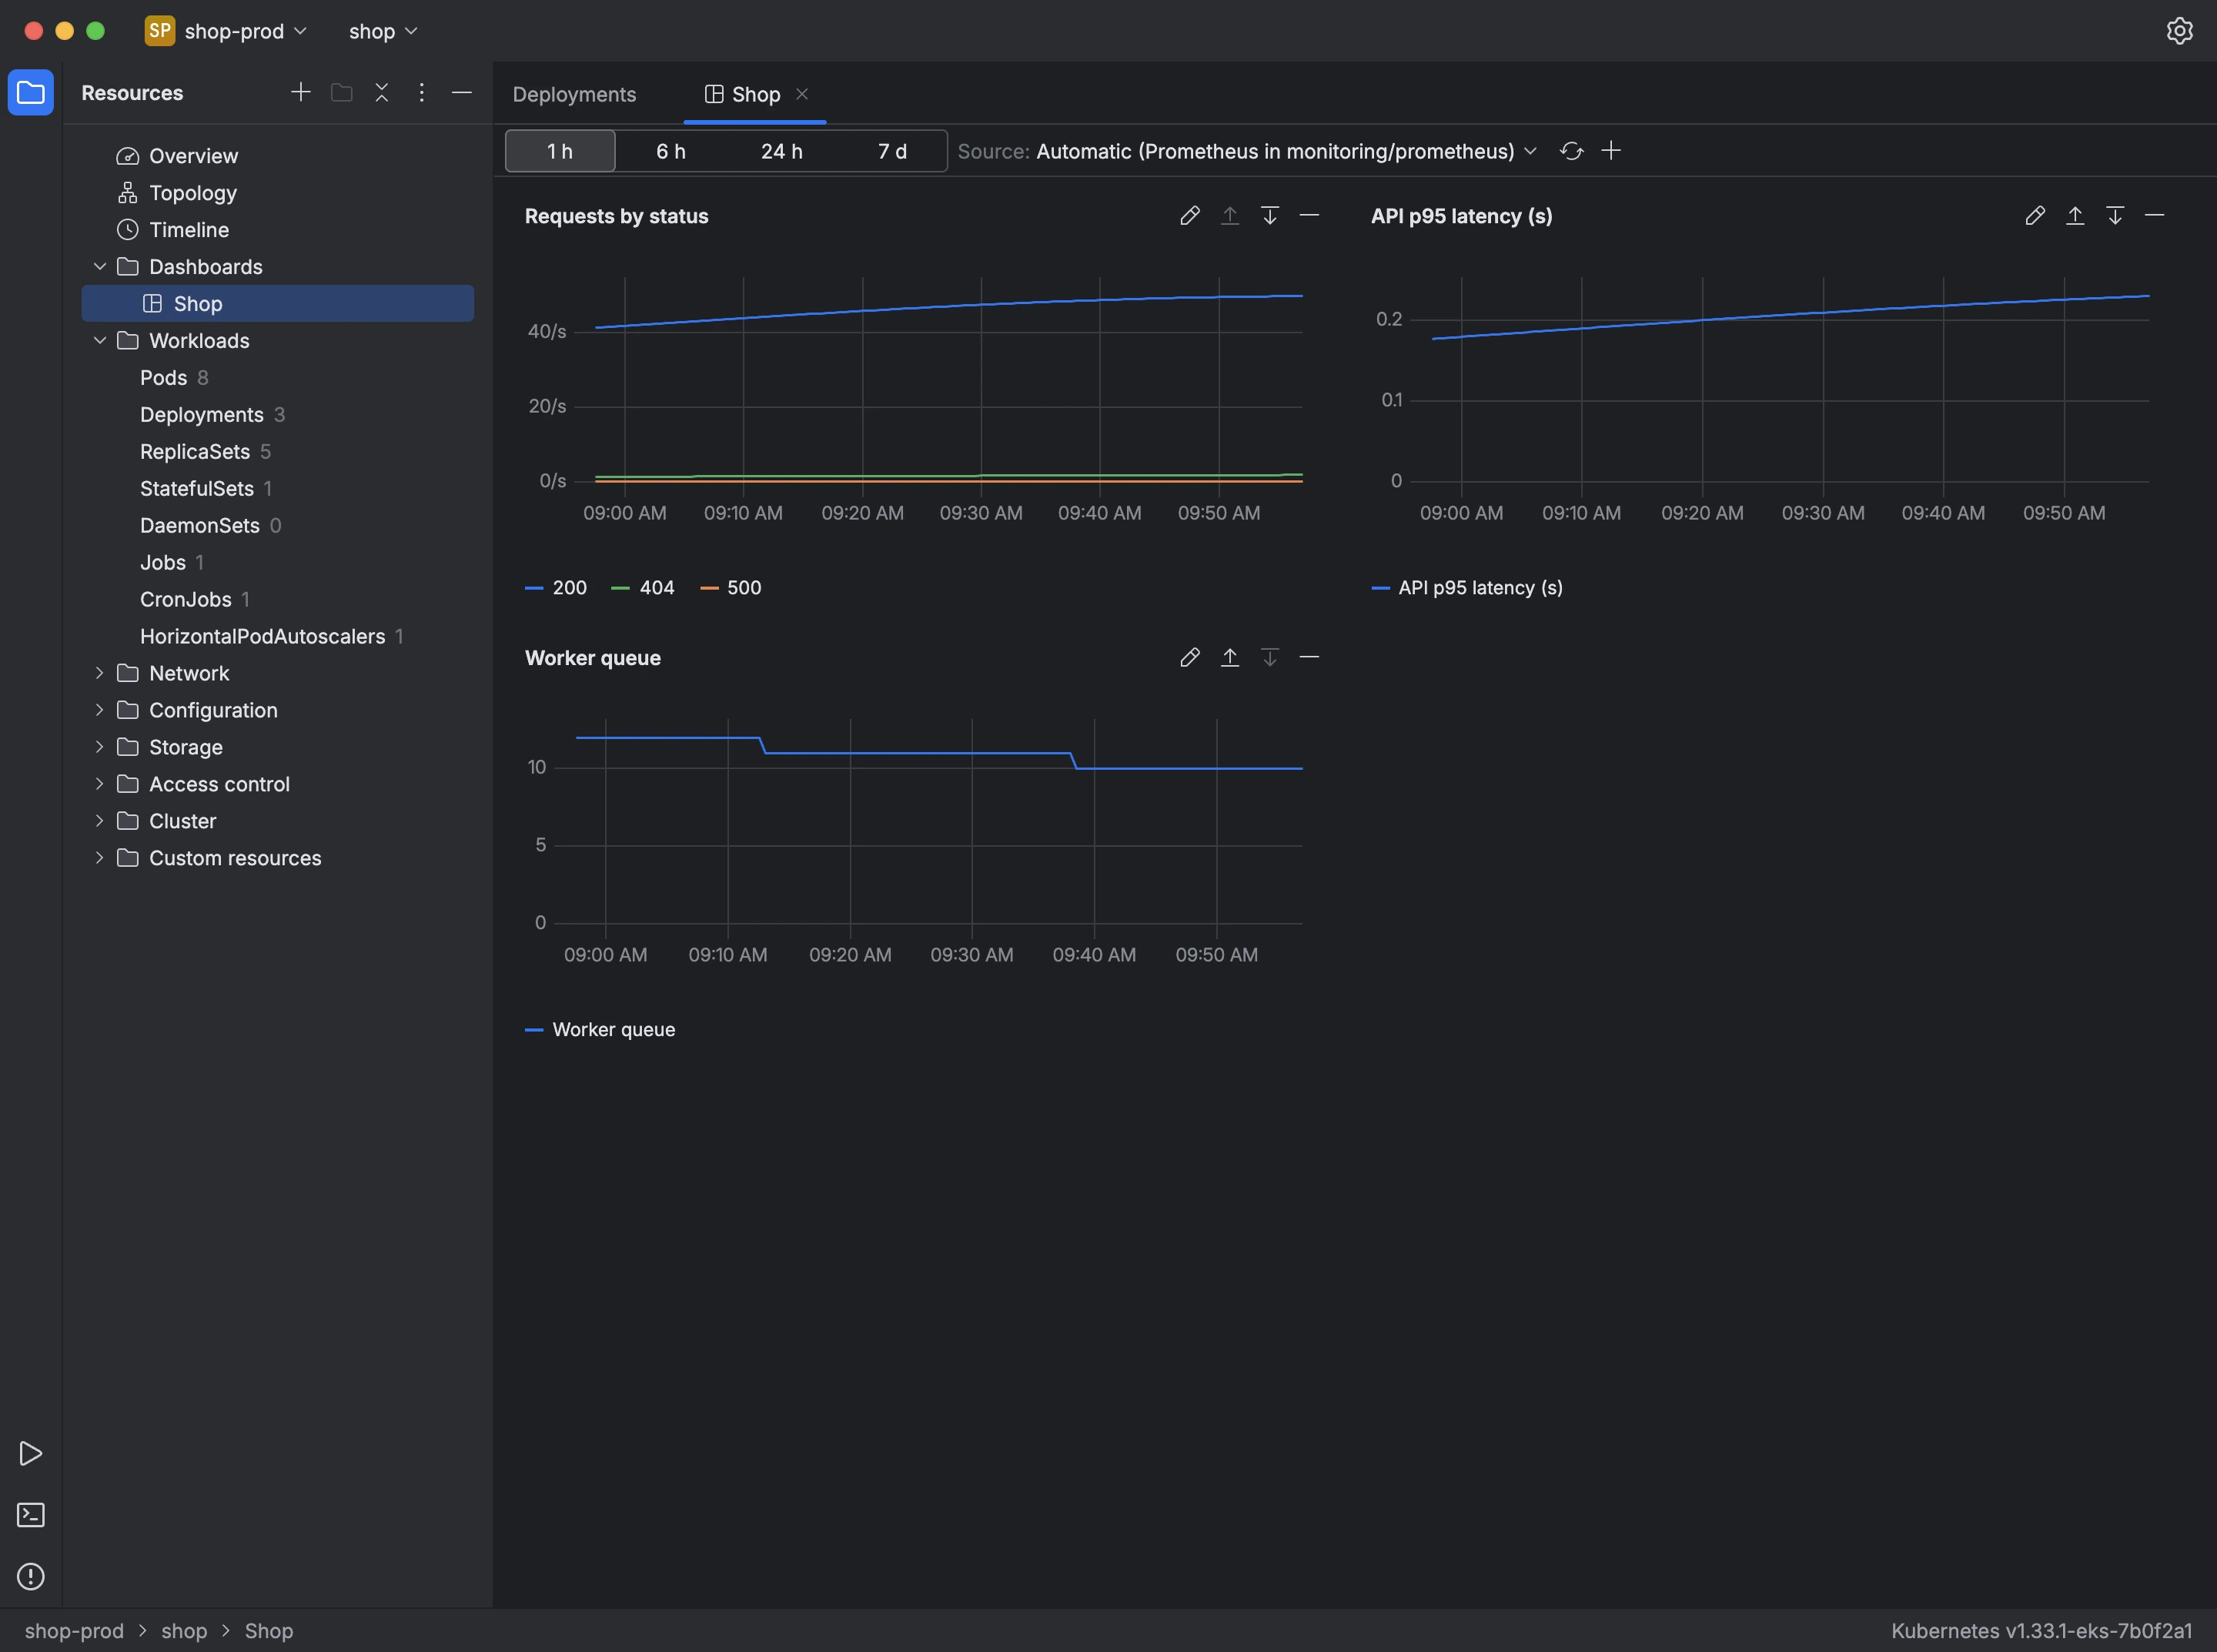
Dashboards are listed under Dashboards in the tree. Each one holds charts of queries to the Prometheus that Kuberniq finds in the cluster, or to the one you choose in Source.
- Open the Dashboards menu, choose New dashboard… and name it.
- Press Add chart…, give the chart a title and write its PromQL.
- Choose how values are formatted - number, percent, cores, bytes or per second - and, optionally, the label that names each series.
- Press Test to see how many series the query returns, then Save.
Charts can show a window from 1 hour to 7 days. You can edit, reorder or remove each chart, and rename or delete a dashboard without changing anything in the cluster.