
Overview and analysis
See the state of the whole cluster on one screen, with an analysis that points out what is failing or at risk, why it matters and what to do.
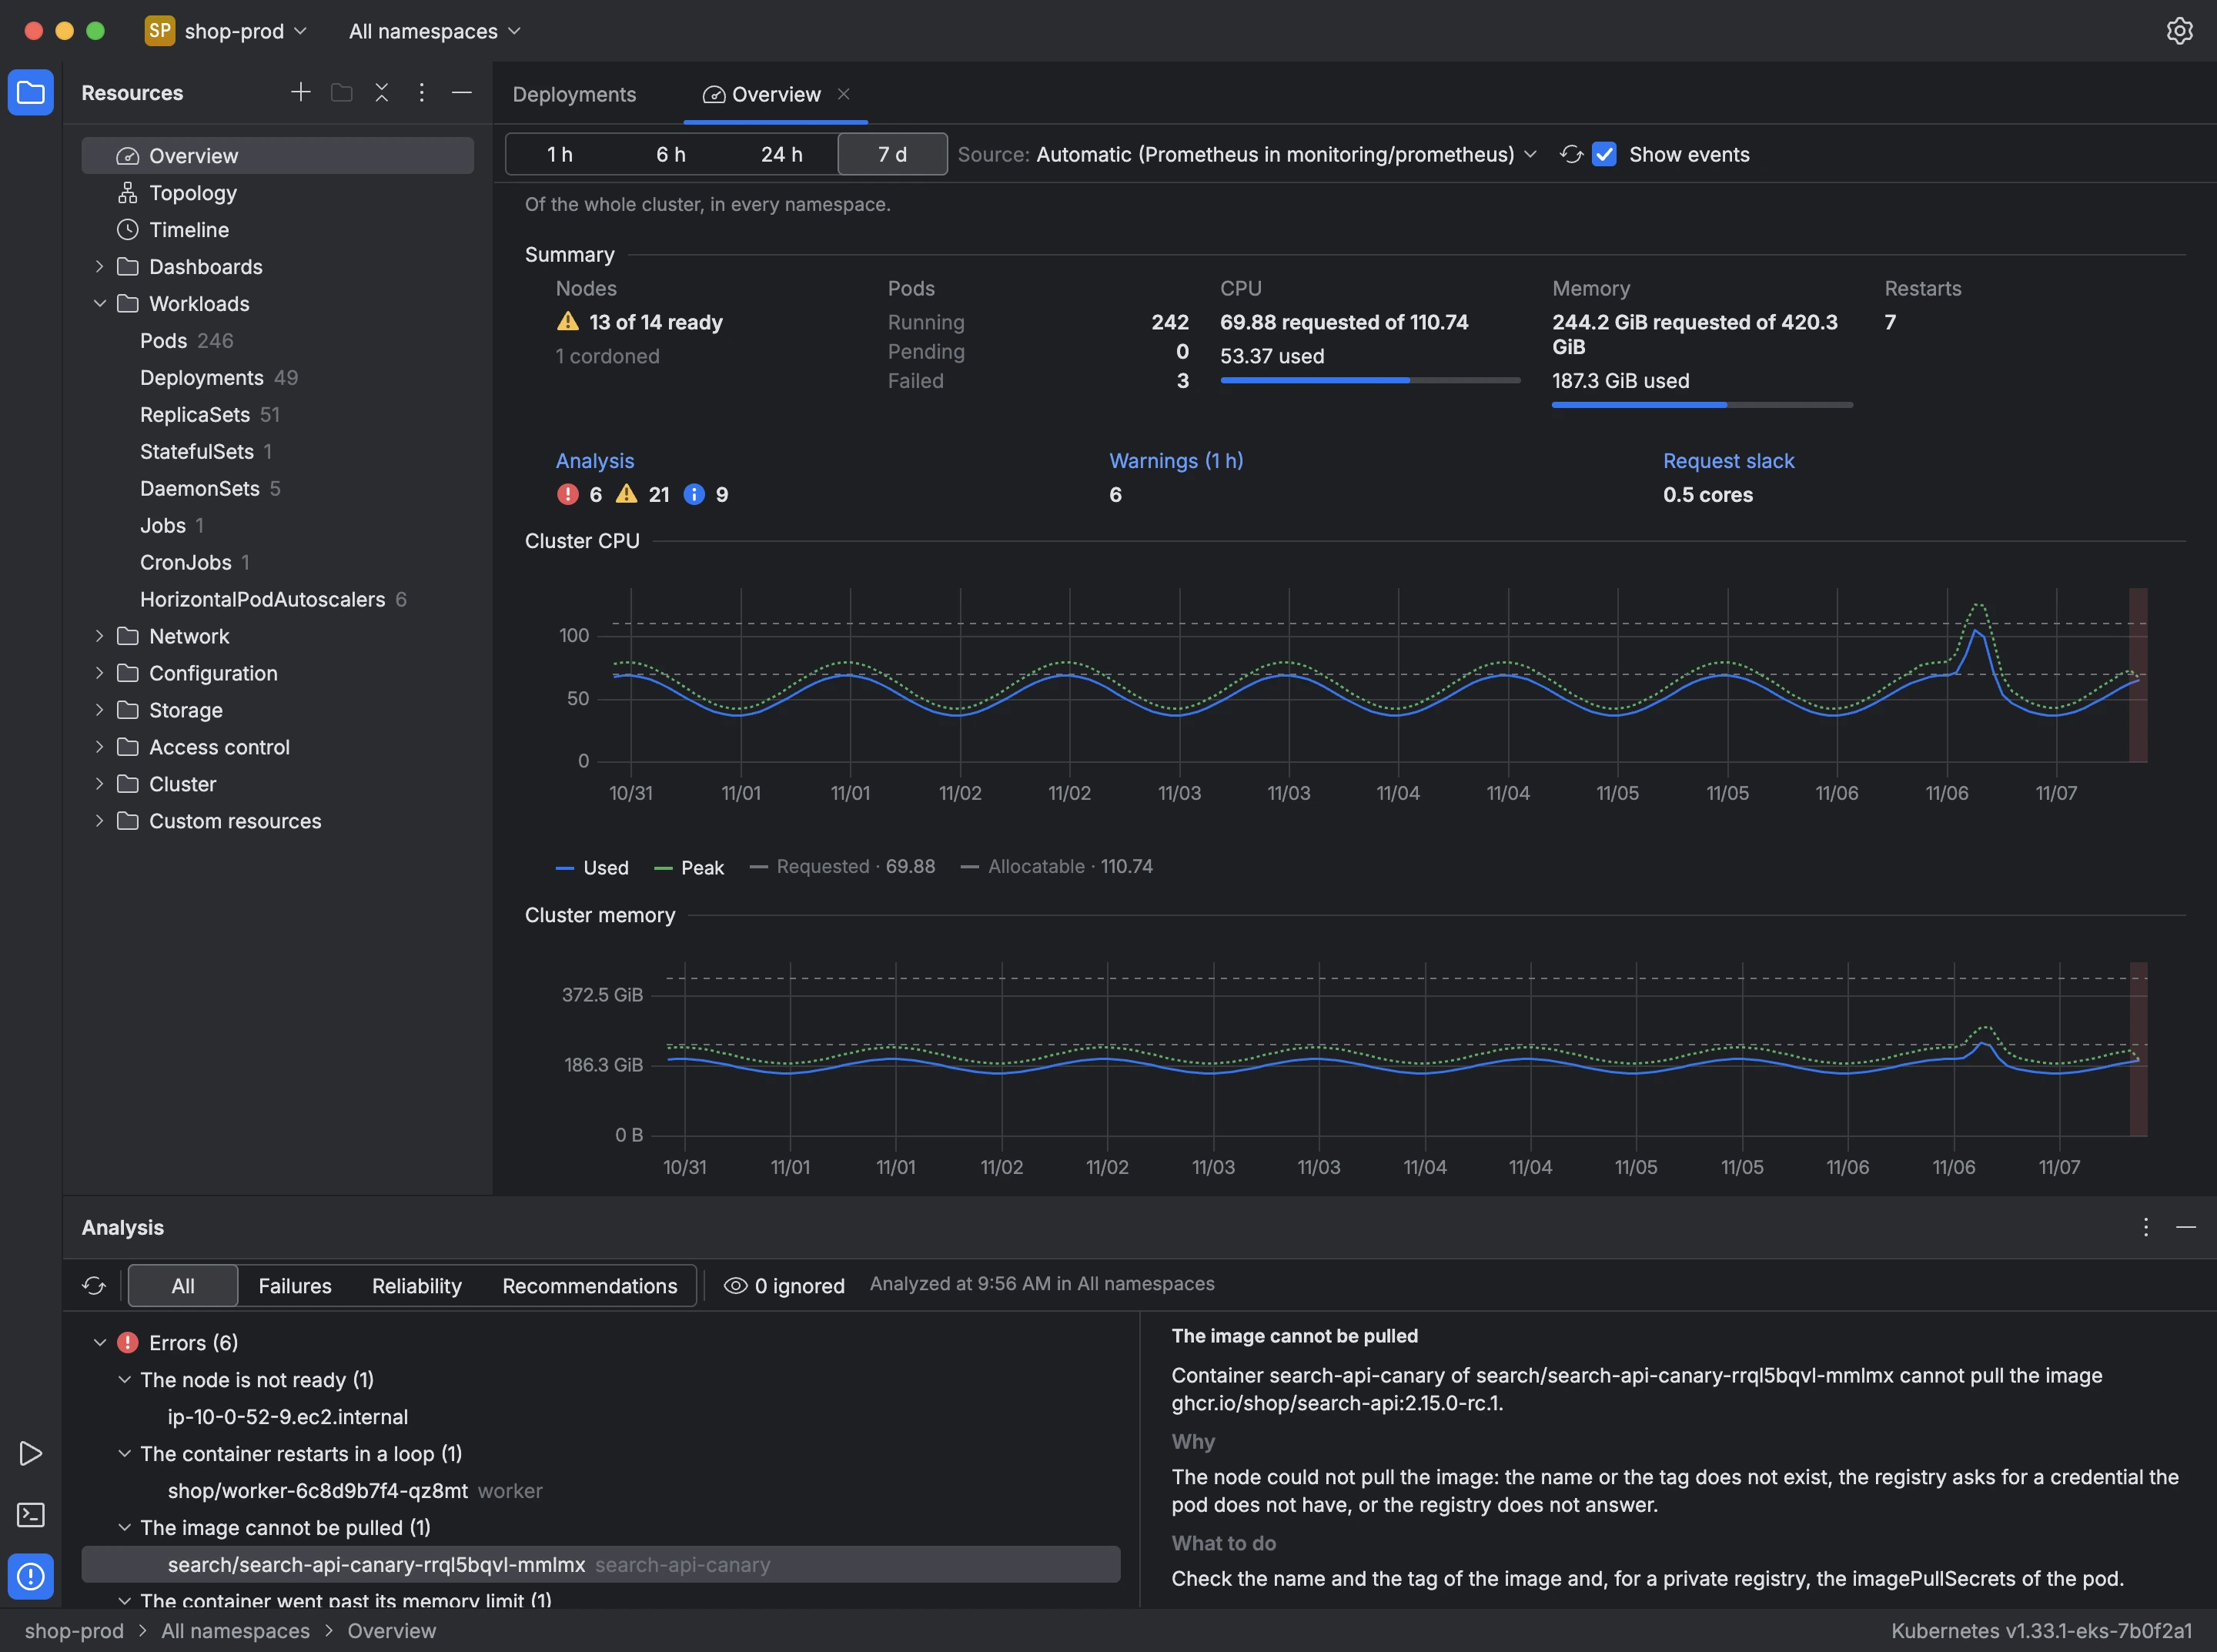
Overview, at the top of the tree, summarizes the cluster:
- Nodes that are ready, not ready and cordoned.
- Pods by phase, and the total container restarts.
- CPU and memory requested out of what the nodes can allocate, and how much is in use.
- The analysis findings by severity, the warnings from the last hour, and the request slack: what containers request beyond what they use.
The charts show cluster usage over the window you choose, from 1 hour to 7 days, read from the cluster's Prometheus when there is one and sampled by Kuberniq otherwise.
The Analysis panel reads the cluster and lists its findings in three categories:
- Failures, such as a container in CrashLoopBackOff, an image that can't be pulled or a service with no endpoints.
- Reliability, such as a container with no memory limit, or a workload with a single replica or no PodDisruptionBudget.
- Recommendations, such as a container that requests more than it uses.
Select a finding to read what was seen, why it matters and what to do, and to open the resource's manifest, metrics or log. You can ignore a finding on that resource, or ignore the rule for the whole context.