
Timeline and topology
See what happened in a namespace or to a resource over time, and how a namespace's resources connect, with analysis findings on each one.
Timeline, in the tree, lays out what happened in the namespace in lanes: events, rollouts, restarts and terminations, scaling, pods created and deleted, node conditions and finished jobs. Choose a window from 1 hour to 7 days, show only warnings and errors, or filter by kind; Follow Now keeps the timeline moving with the present. Select an entry to see its details and open the resource it concerns. Kuberniq keeps what it observes in the context; before it started observing, the timeline shows what the objects themselves record and the recent events.
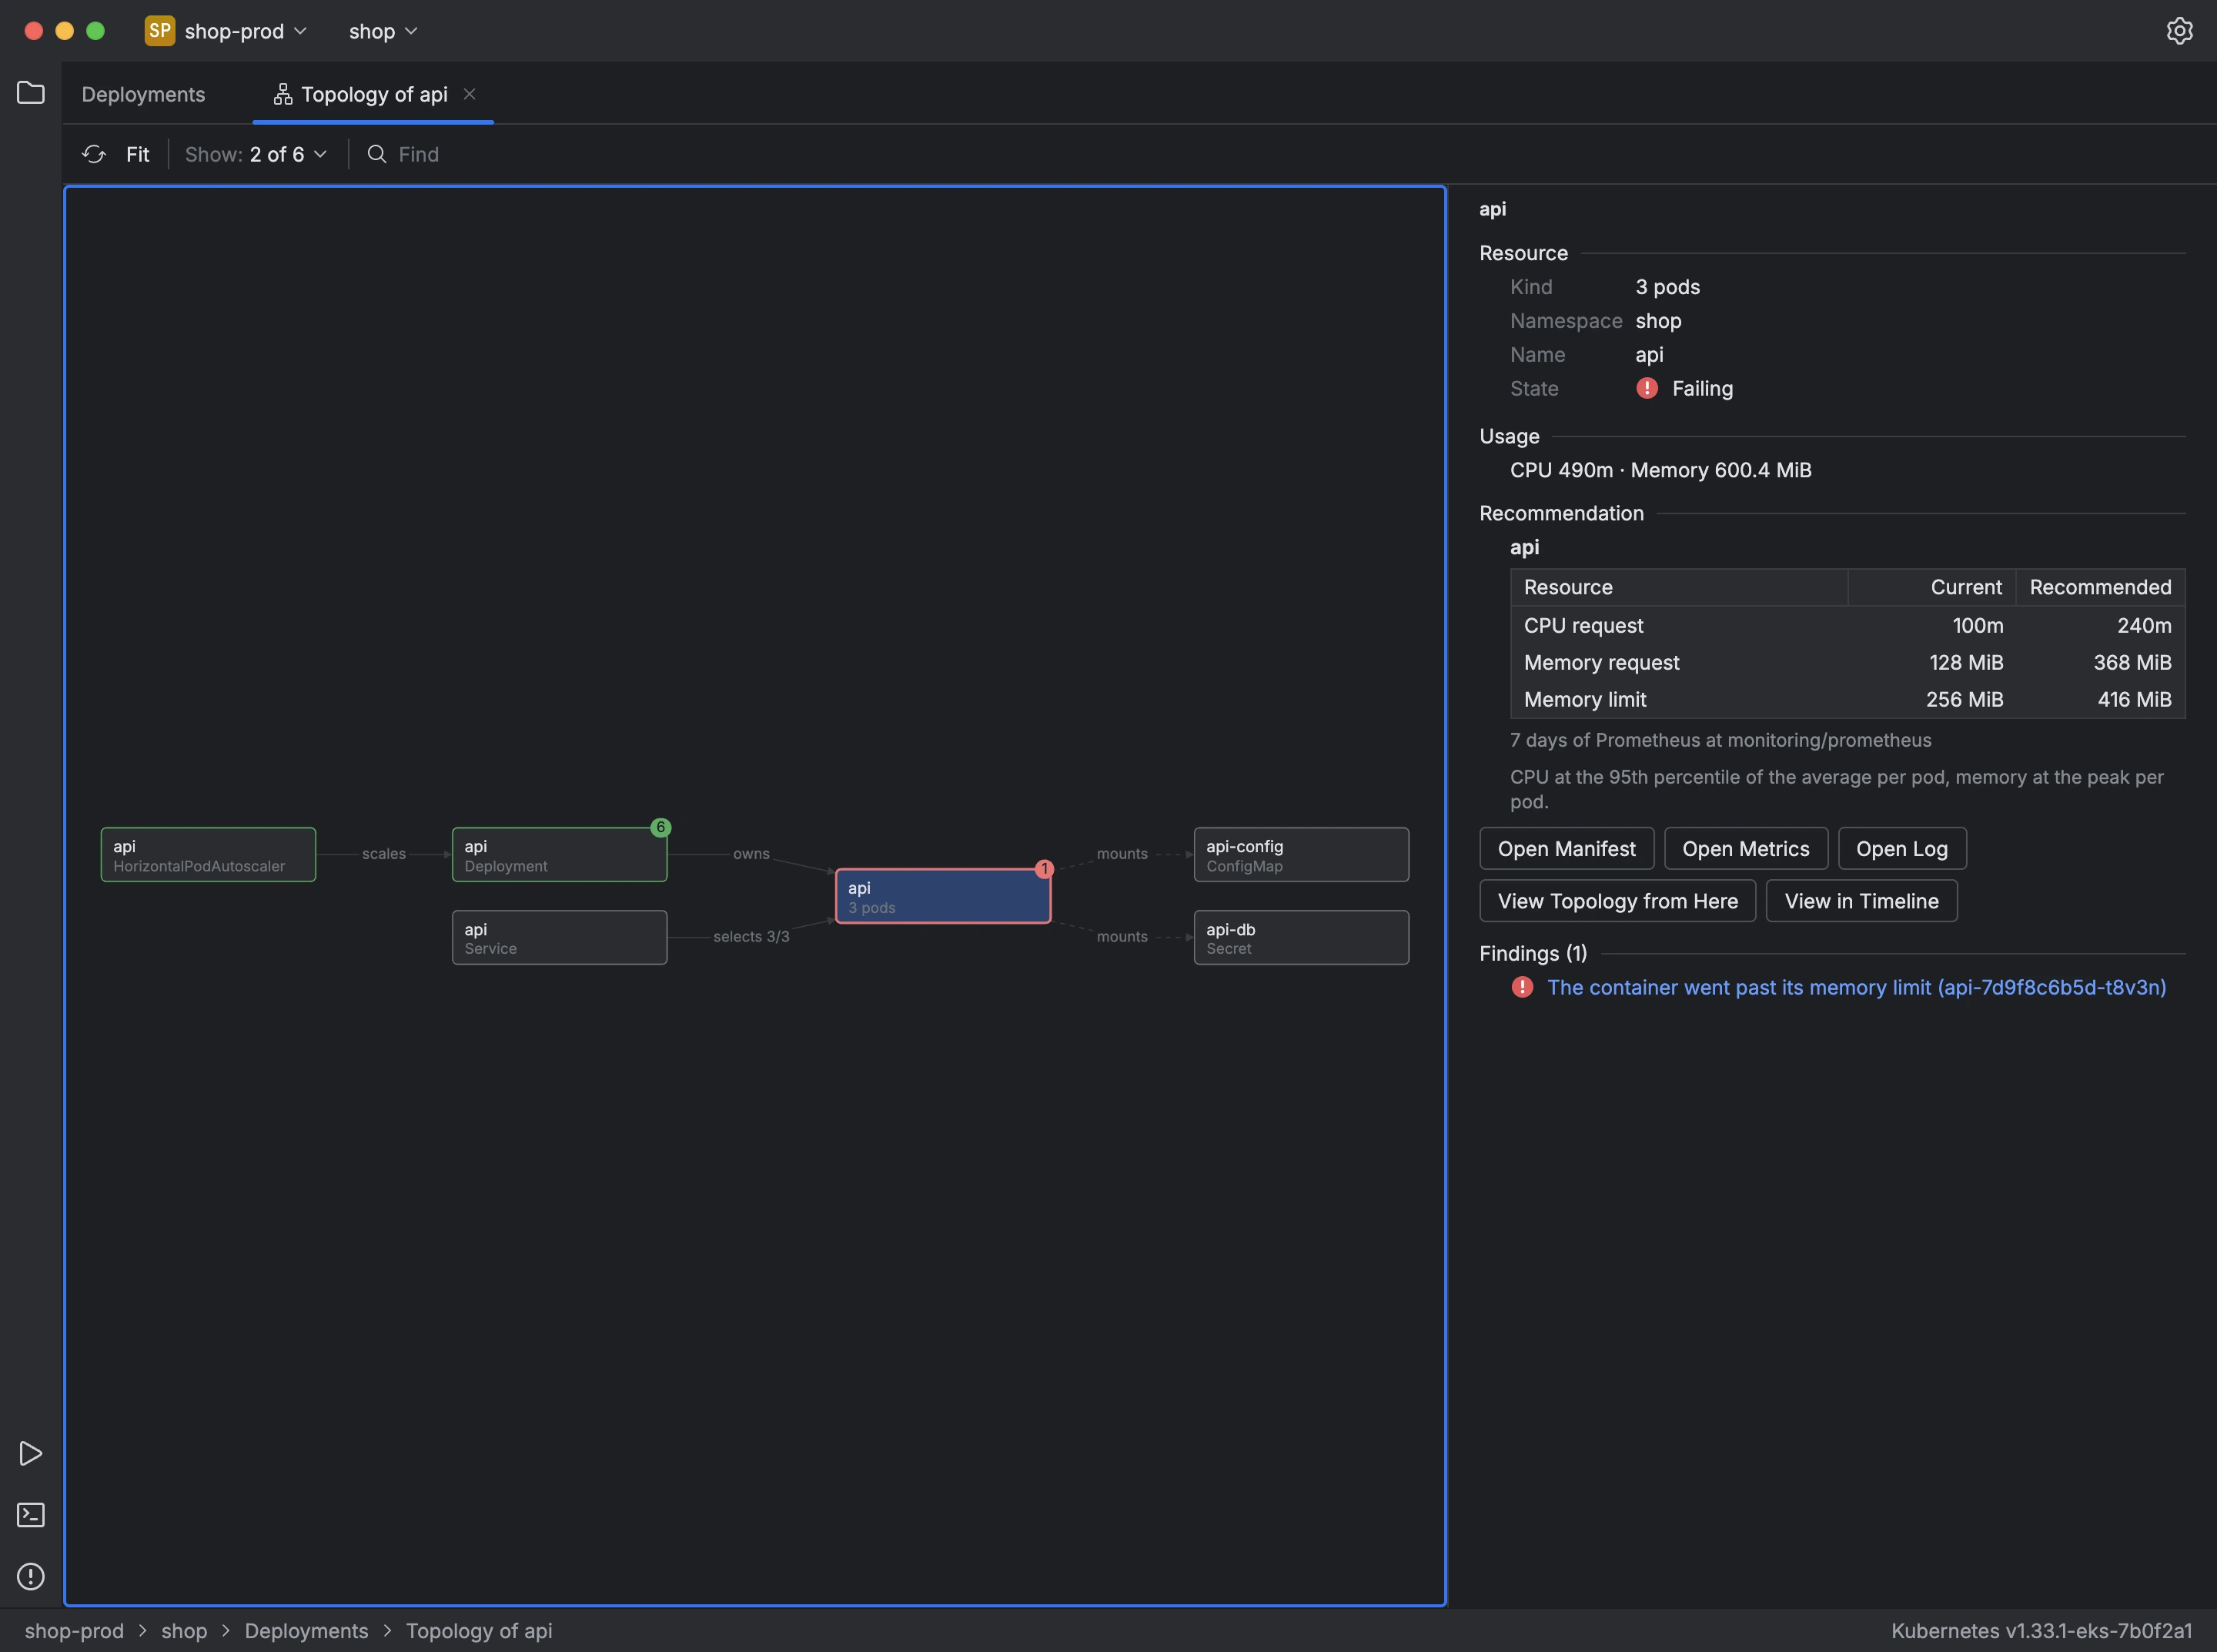
Topology, in the tree, draws the namespace's resources and how they connect: what owns, selects, routes to, mounts and scales what. Each node shows its state and how many analysis findings it has.
- Select a node to see its kind, state, usage, recommendation and findings.
- From the details, open its manifest, metrics, log or timeline, or redraw the topology starting from it.
View Topology and View in Timeline, in a resource's menu, open either one centered on that resource.